What the AI actually does
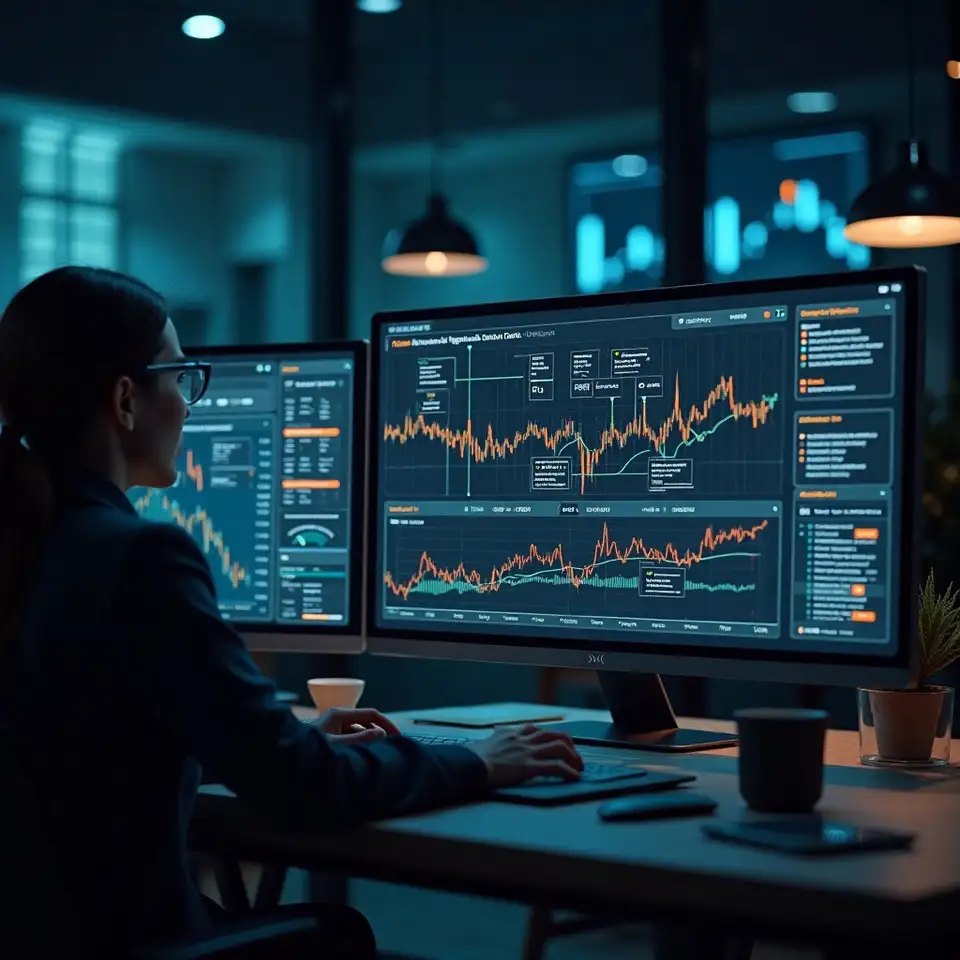
You are not here for slogans. You are here to see, step by step, how AI supported smart money tracking can fit into a serious research process without pretending to predict the future.
You have probably seen feature lists that feel like marketing gloss. This section is different. Here, you see how one typical session with Maroveni might unfold. You log in and choose a window of time to review. The system loads institutional sized trades, dark pool prints, and block transactions for that period. You scan a heatmap that shows where hidden liquidity concentrated, then flip to a timeline that clusters notable sequences. When the AI flags a potential pattern, you can open a detail view that explains which features mattered most, such as repeated large prints in a specific venue or a sudden shift in dark pool usage. You can accept the pattern as worth tracking, mark it as noise, or adjust the thresholds and rerun the scan. You add a brief note on what you think might be happening, save the sequence, and move on. Days or weeks later, you return to see how that pattern played out, comparing your initial narrative with what actually unfolded. This loop helps you refine which behaviours you treat as meaningful, while remembering that past performance does not guarantee future results, and results may vary.
Ask usYou have probably used tools that promise clarity but hide how they actually work. On this page, you pull the process into the open. You see what Maroveni does, step by step, when it uses AI for financial market research to track smart money behaviour across institutional trades, dark pools, and block transactions. You start with raw data. Time, venue, size, flags. Our systems ingest reported trades from multiple venues, including dark pool and block prints where available, and run them through cleaning rules designed to reduce obvious glitches and duplicates. You then move into classification. The models look at order size, venue characteristics, and context to estimate which trades are more likely to reflect institutional behaviour rather than routine small flow. Thresholds are adjustable, because you know there is no single definition that fits every situation or asset. Next comes pattern assembly. Instead of reacting to one large trade, you examine chains of related activity. The AI groups trades that share similar features, timing, or venue shifts, then maps them into sequences that might indicate accumulation, distribution, or rebalancing. You review these sequences in dashboards that show timelines, venue splits, and heatmaps of hidden liquidity. Finally, you enter the interpretation stage. Here, you use plain language summaries and your own notes to decide which patterns deserve attention for your time horizon. The system suggests possible narratives but never claims certainty. You are reminded that AI can misread noise as signal, that past performance does not guarantee future results, and that results may vary. Maroveni does not offer personal advice. It offers a transparent workflow you can question, refine, and fold into broader conversations about financial planning and analytical reviews.
Talk with usKey venues examined, including public exchanges and dark pools
Finally, you hold onto skepticism. You know that AI can connect dots that should stay separate. You review how each pattern is built, cross check with other information, and remind yourself that past performance does not guarantee future results. You use Maroveni to support analytical reviews and planning conversations, fully aware that results may vary and that you remain accountable for your choices.
You have probably seen fine print that tries to soften bold promises. Maroveni flips the order. The limits come first, so you can decide whether the tools make sense for you.
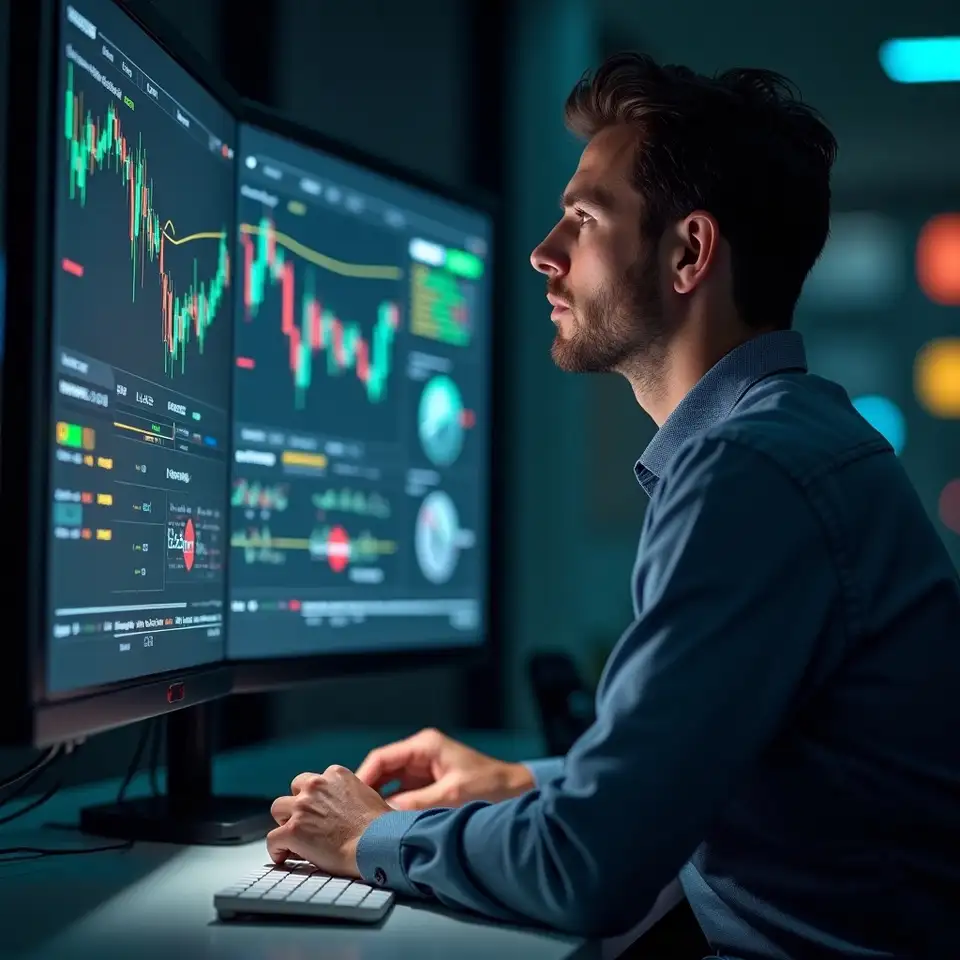
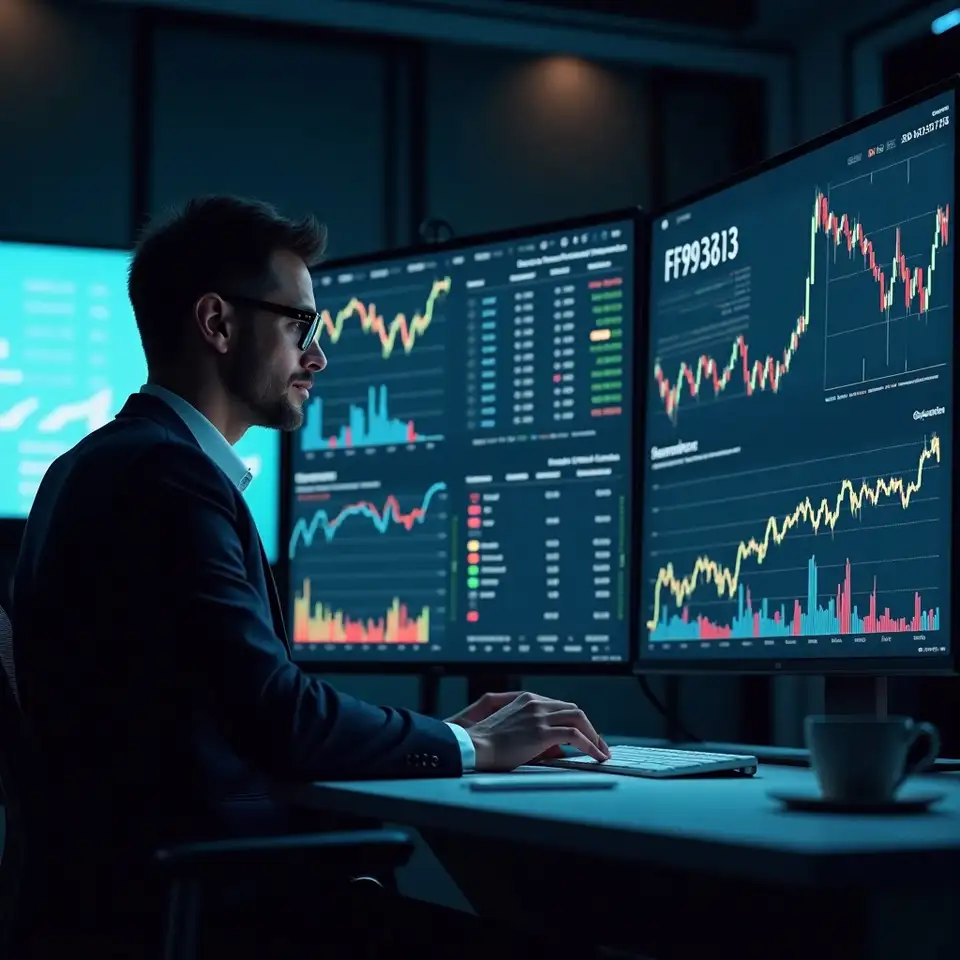
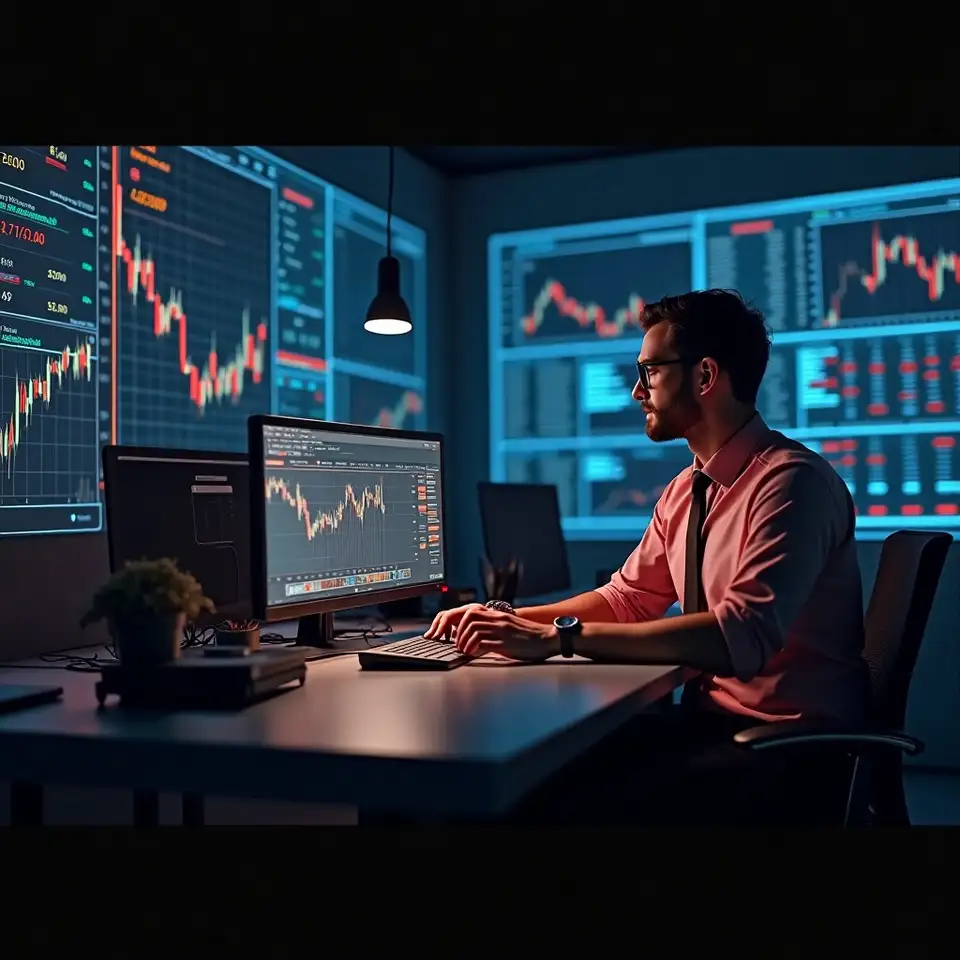
You have probably wondered what AI driven smart money tracking actually looks like in practice. These snapshots show how Maroveni turns institutional trades, dark pools, and block transactions into visual maps and narrative reports you can question, annotate, and revisit over time.
You see a consolidated view of institutional sized trades from multiple venues, including dark pools and block reports, arranged in a single research panel.
ai dashboard showing institutional trades across venues
You explore heatmaps that reveal where dark pool activity clusters during different sessions, giving you a visual sense of hidden liquidity.
You review timelines that group large orders into sequences, helping you see whether activity appears as isolated events or part of a broader campaign.
You read annotated reports that translate complex flows into plain language notes you can bring into planning and review discussions.
You start by clarifying your horizon and focus. Shorter term noise or multi year structure. Then you configure which venues and trade sizes to watch, especially around dark pools and block transactions. The AI runs in the background, scanning for patterns, while you stay in charge of interpretation and decisions. Past performance does not guarantee future results, and results may vary.
You begin by anchoring everything in observable behaviour. You are not guessing who might be trading. You are looking at reported institutional sized orders, dark pool activity, and block transactions. The AI helps you scan and group them, but you always know which underlying prints each pattern refers to. This focus on concrete traces keeps your research grounded when narratives start to drift.
You then treat AI as a pattern scout, not a decision engine. The models highlight unusual clusters, venue shifts, or timing that might deserve a closer look. You decide what to do next. Sometimes that means digging deeper. Sometimes it means dismissing the alert as noise. Either way, you stay responsible for judgment, and you remember that past performance does not guarantee future results.
You fold the insights into broader conversations rather than acting on them in isolation. You bring observations about institutional flows, dark pools, and block trades into discussions about financial planning, risk awareness, and scenario analysis. The patterns become one lens among many, sitting alongside fundamentals, macro views, and your own constraints.
Build your own archive
You commit to documenting what you see and how you respond. Each time you review a sequence, you log your interpretation and any later outcome you consider relevant. Over time, this archive reveals which signals you tend to overvalue, where you underreact, and how your thinking changes. It helps you stay honest with yourself, even when a pattern looks compelling on screen.
You stay within clear boundaries. Maroveni does not offer personal advice or promises about outcomes. It provides tools for research into institutional behaviour and hidden liquidity. You are reminded that AI can misread noise as signal, that past performance does not guarantee future results, and that results may vary for every user and every pattern.